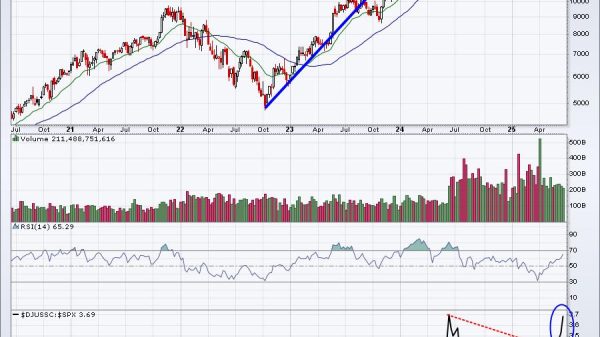
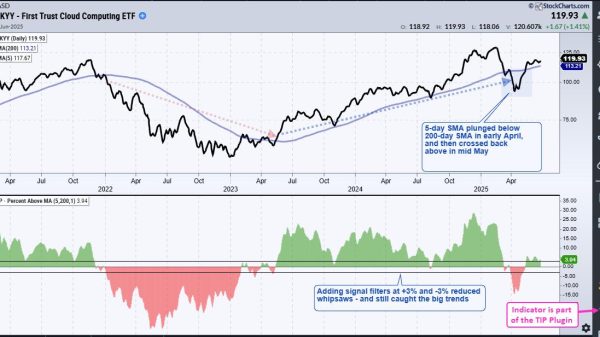
 In this video, Dave reveals four key charts he’s watching to determine whether the S&P 500 and Nasdaq 100 will be able to power through their 200-day moving averages en route to higher highs. Using the recently updated StockCharts Market Summary page, he covers moving average breadth measures, his proprietary Market Trend Model, offense vs. defense ratios, and the Bullish Percent Indexes.
This video originally premiered on May 5, 2025. Watch on StockCharts’ dedicated David Keller page!
Previously recorded videos from Dave are available at this link.


